Navigating the Insights Centre
Updated: 1 Sep 2026
Every sale you ring up turns into a report. This is how to read them: what you took today, where it came from, what discounts cost you, and how your staff are performing.
Rather not read? Skip to the video walkthrough at the bottom of the page.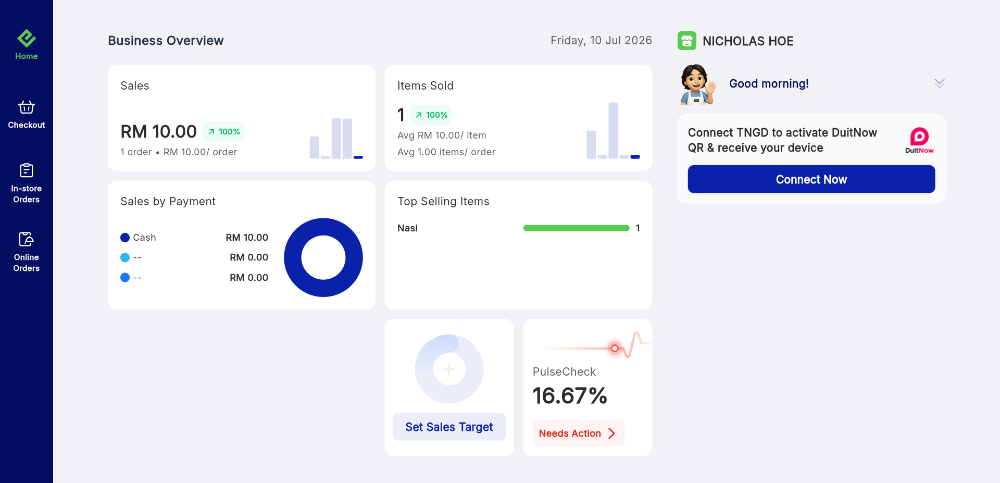
WHO THIS IS FOR
Owners checking the day
- without exporting anything to a spreadsheet.
Managers running shifts
- who need to know which staff and which items are pulling their weight.
BEFORE YOU BEGIN
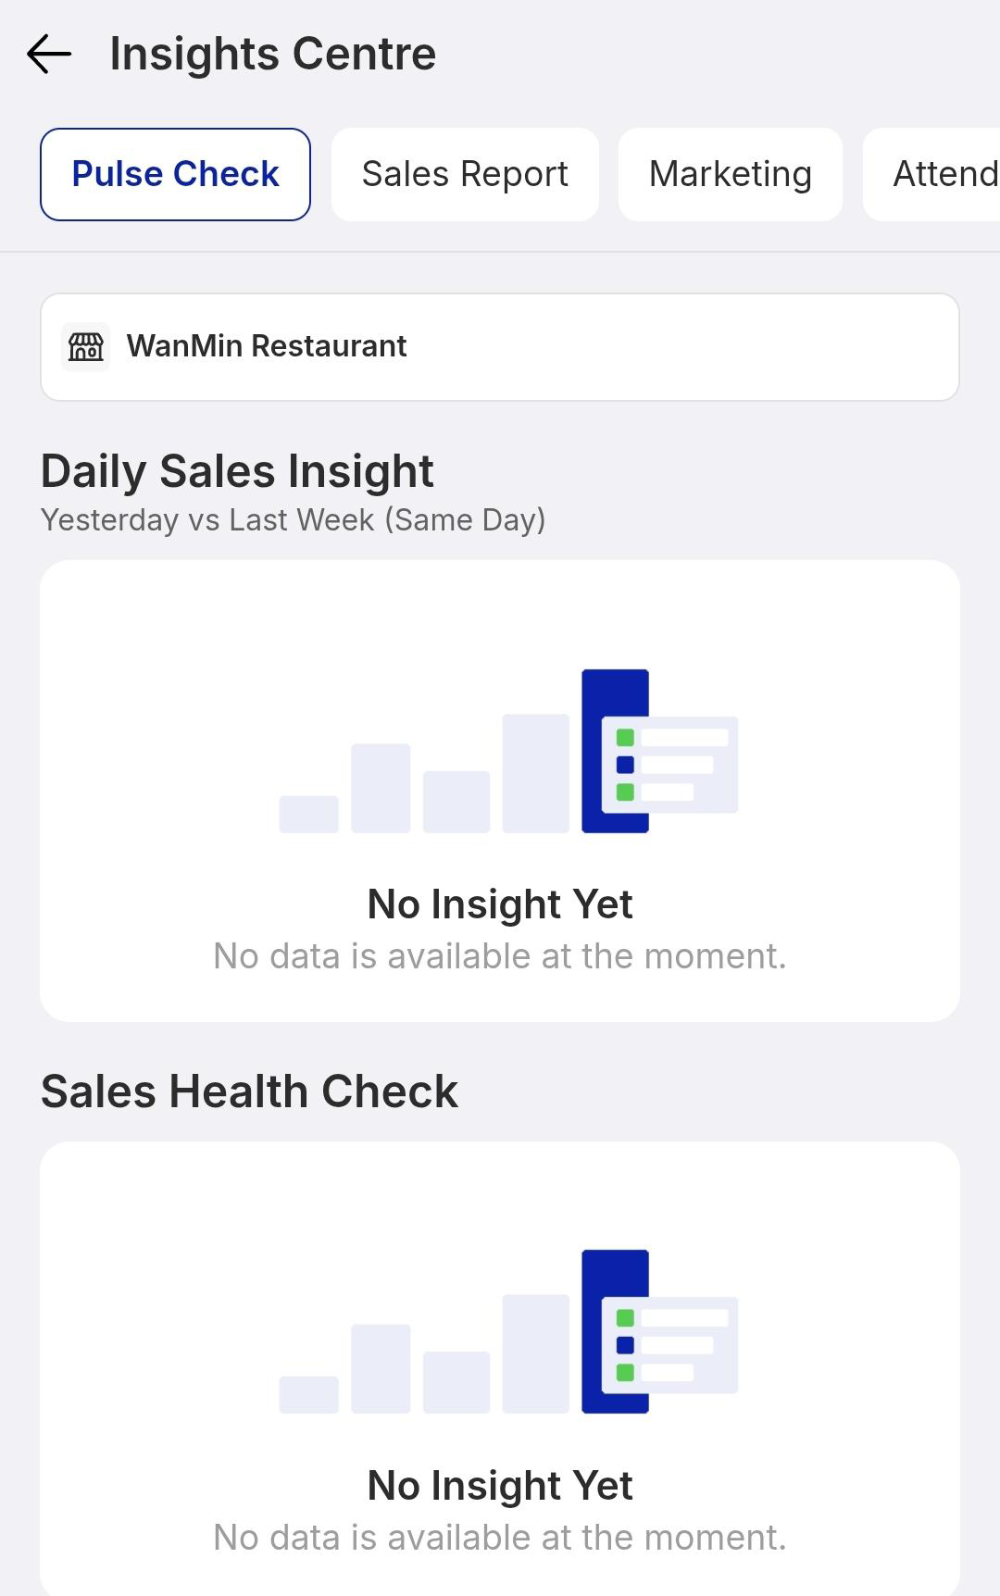
Reports need trading data. A brand-new store shows “No insight yet” until orders start coming through.
Attendance figures come from staff clocking in. Set up employee logins first if the numbers read zero.
Every tab can leave the app. Download and Send to Email sit at the top right of the Insights Centre.
THE STEPS
The same four tabs on tablet and phone — on a phone you swipe the tab row sideways.
Step 1: Read the Business Overview
The top half of the home dashboard is your daily snapshot. Four tiles carry it.
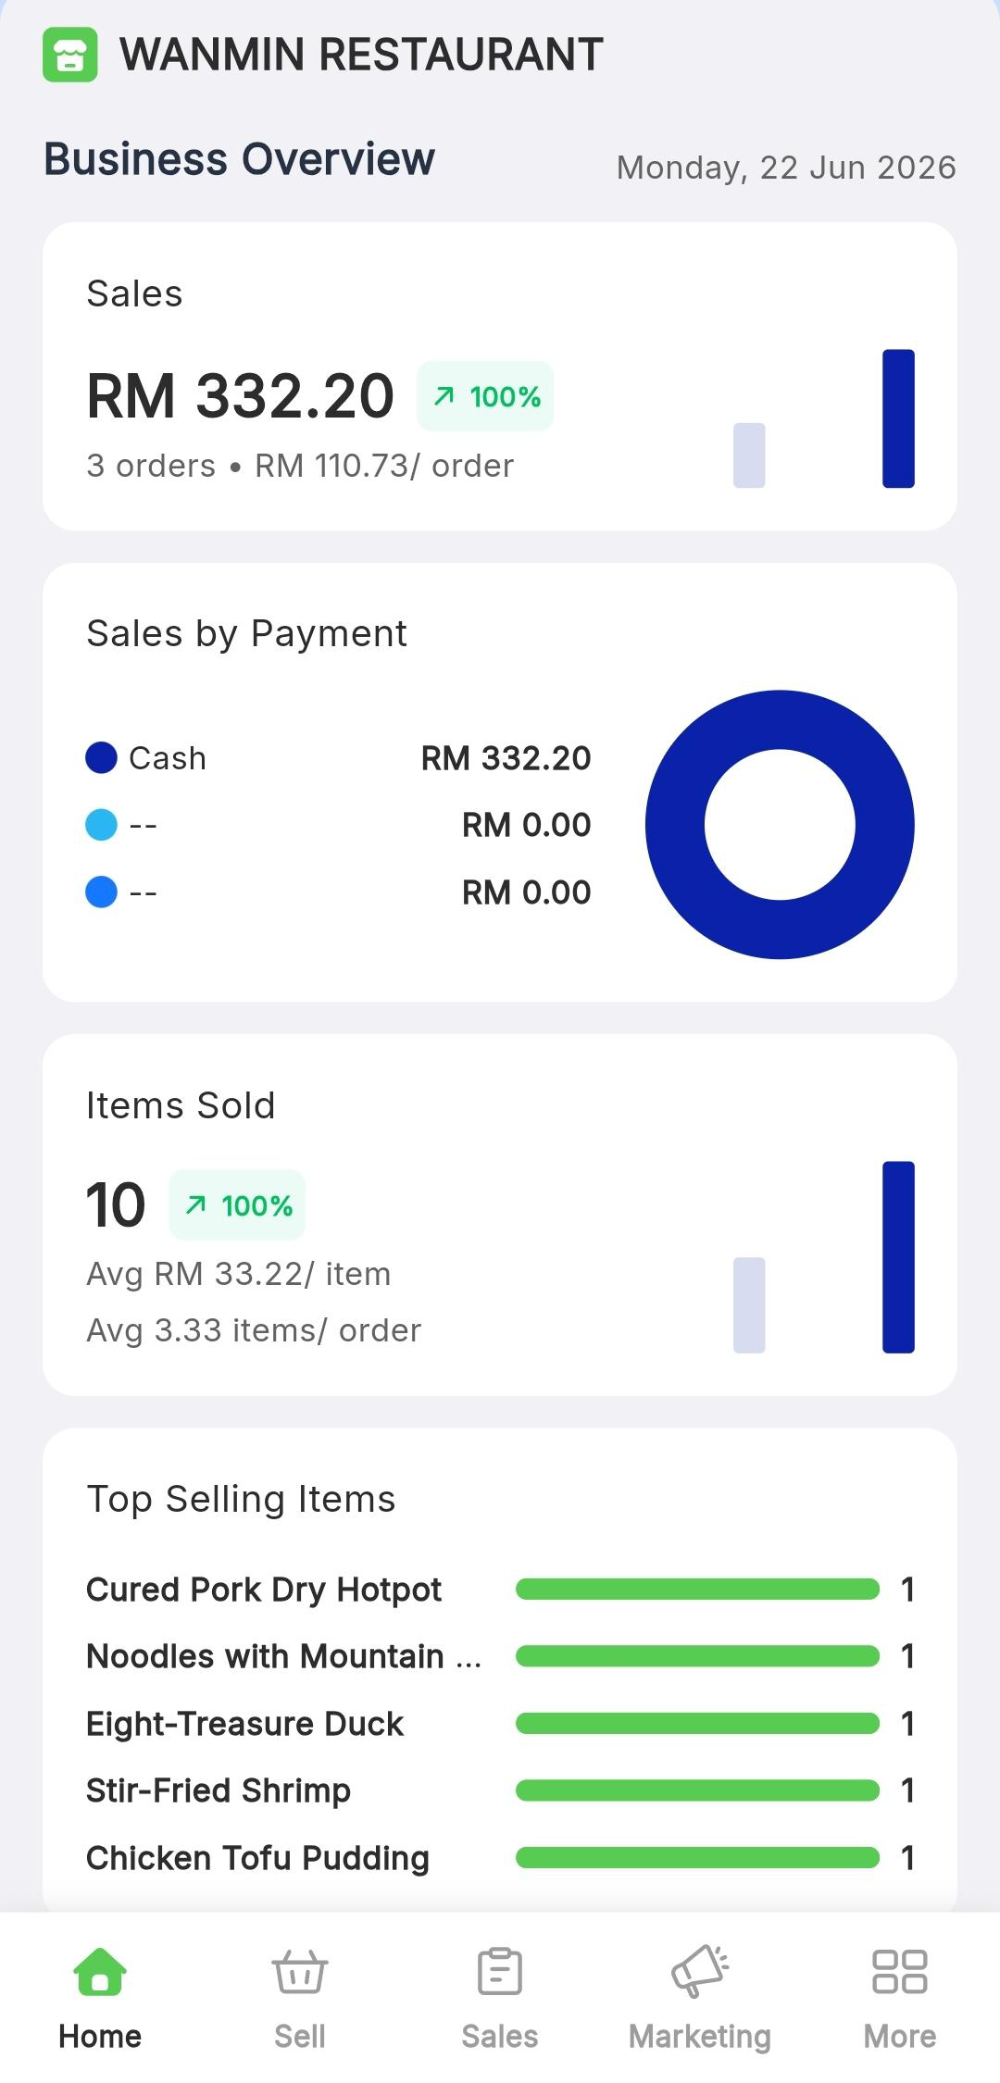
Step 2: Open the Insights Centre
Tap any overview tile and the full Insights Centre opens, with four tabs across the top: Pulse Check, Sales Report, Marketing and Attendance.
Step 3: Read the Sales Report
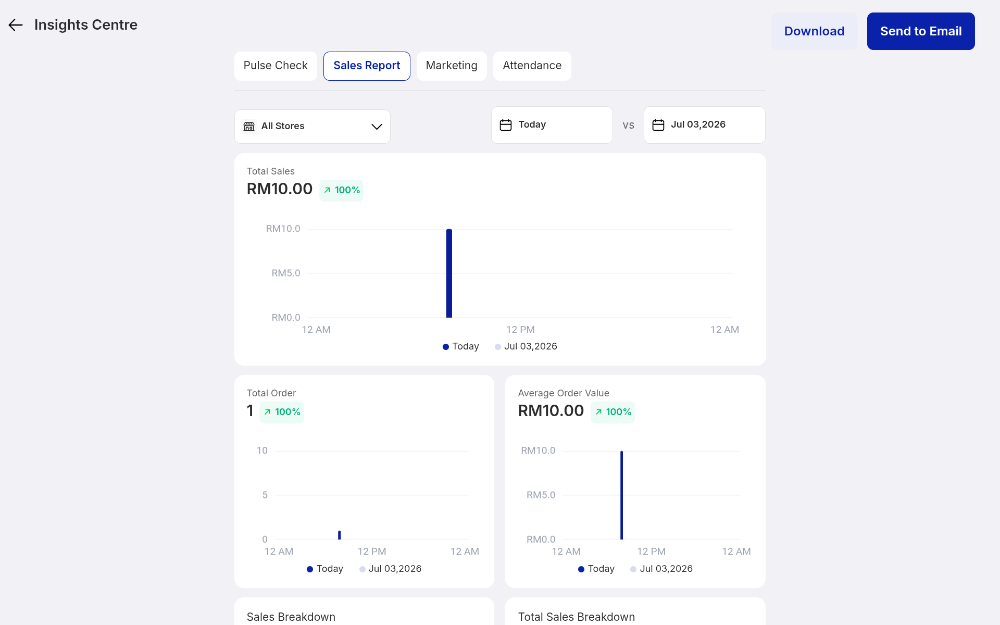
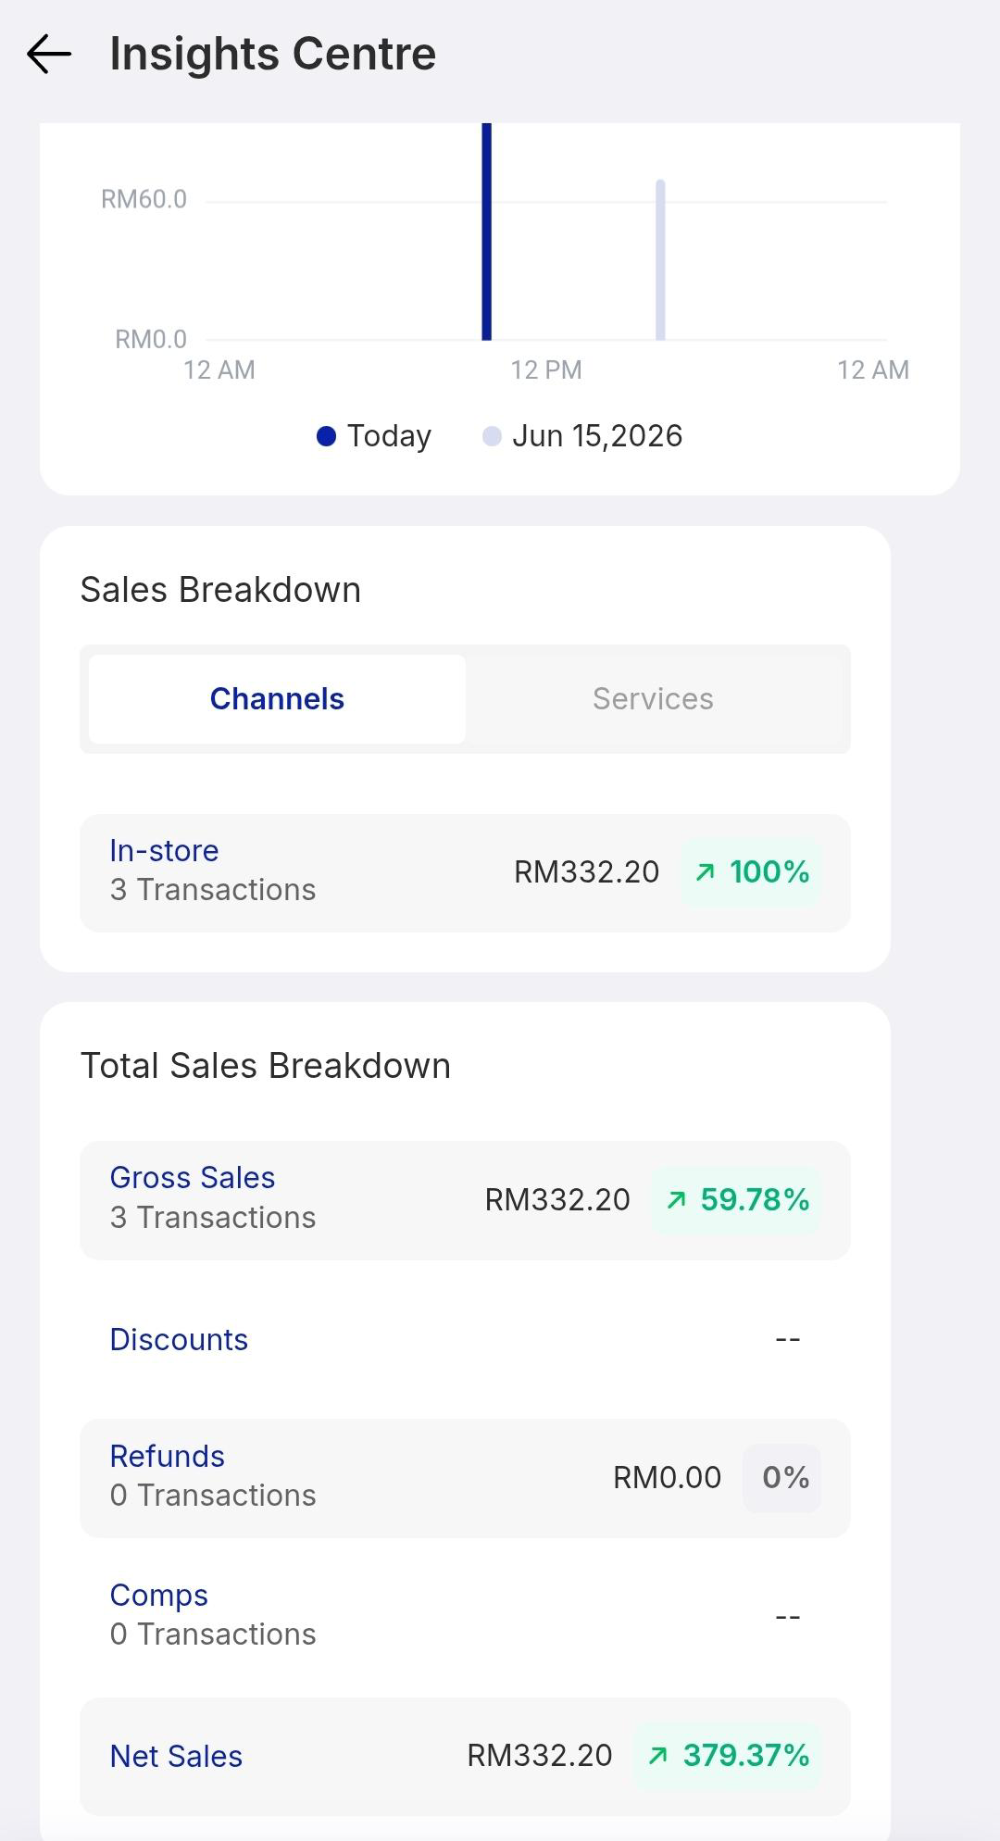
On the Sales Report tab, scroll to Sales Breakdown. Channels splits in-store registers from your online storefronts; Services splits dine-in from pick-up. Below that, Total Sales Breakdown walks from Gross Sales through discounts, refunds and comps down to Net Sales — the number that actually matters.
Step 4: Filter and compare
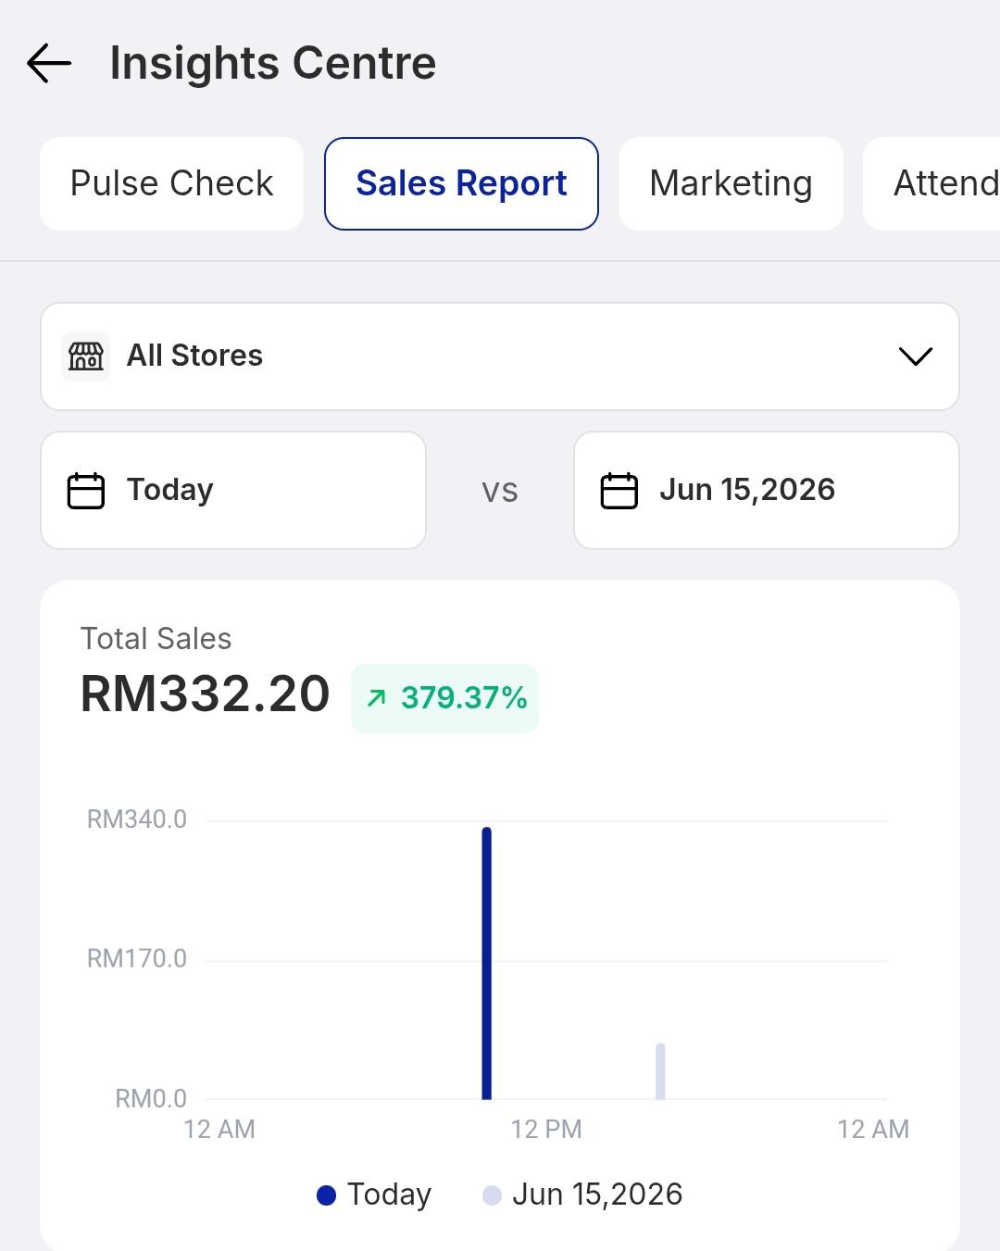
Three controls sit above every report.
Step 5: Run a Pulse Check
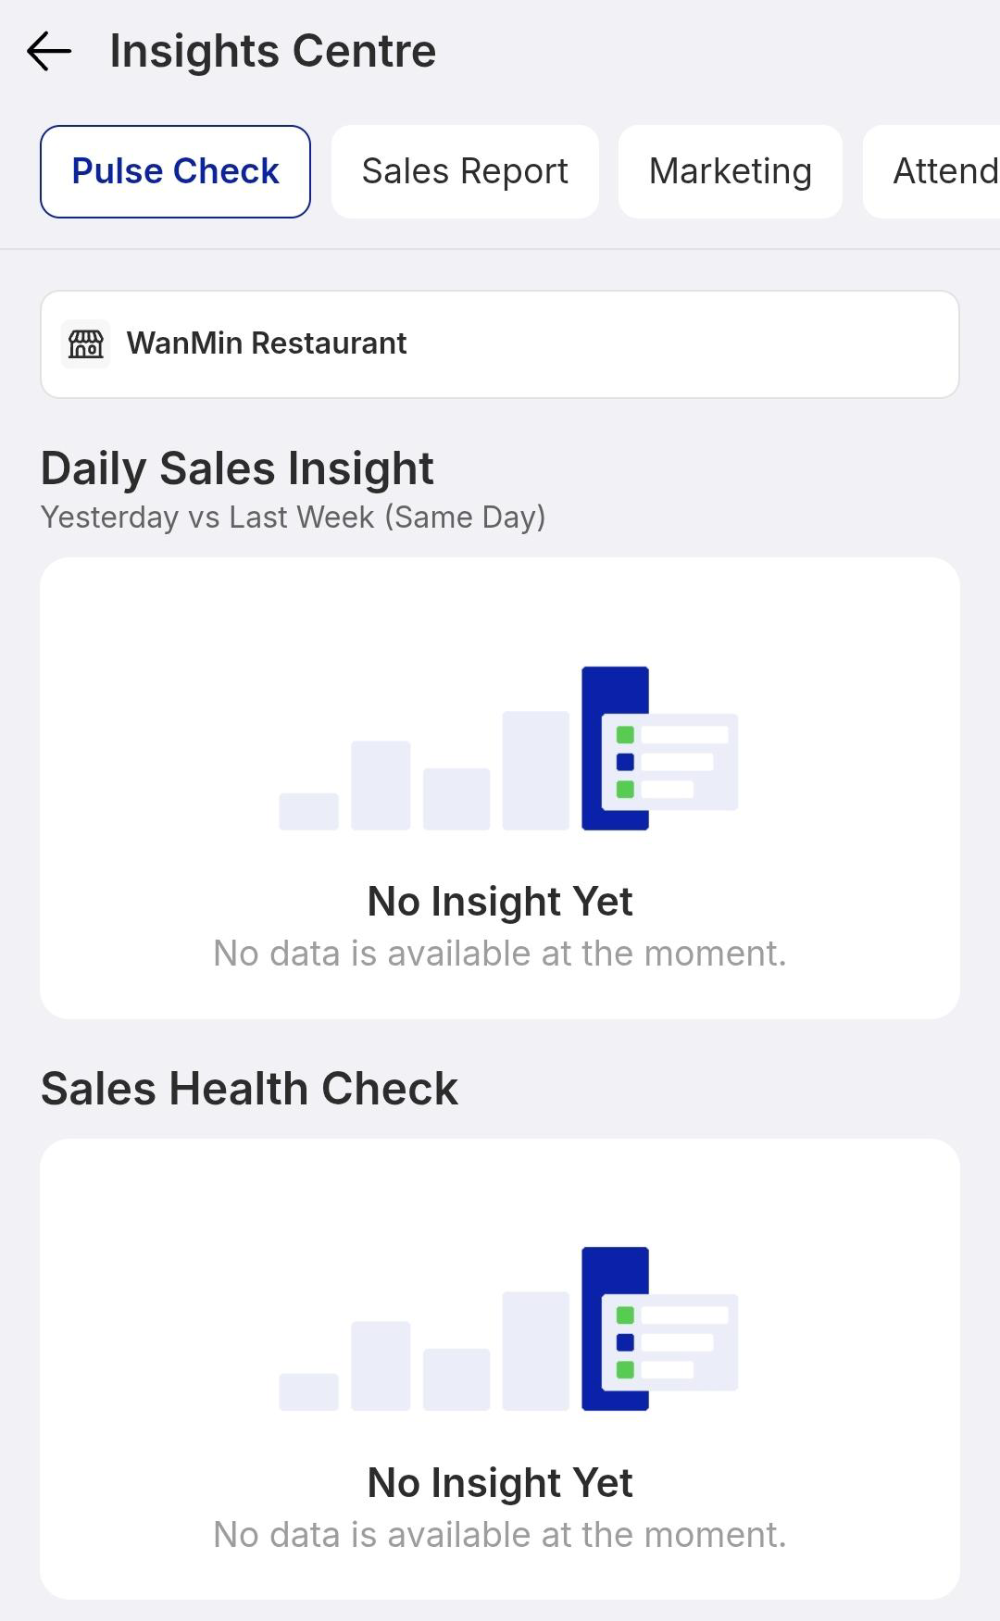
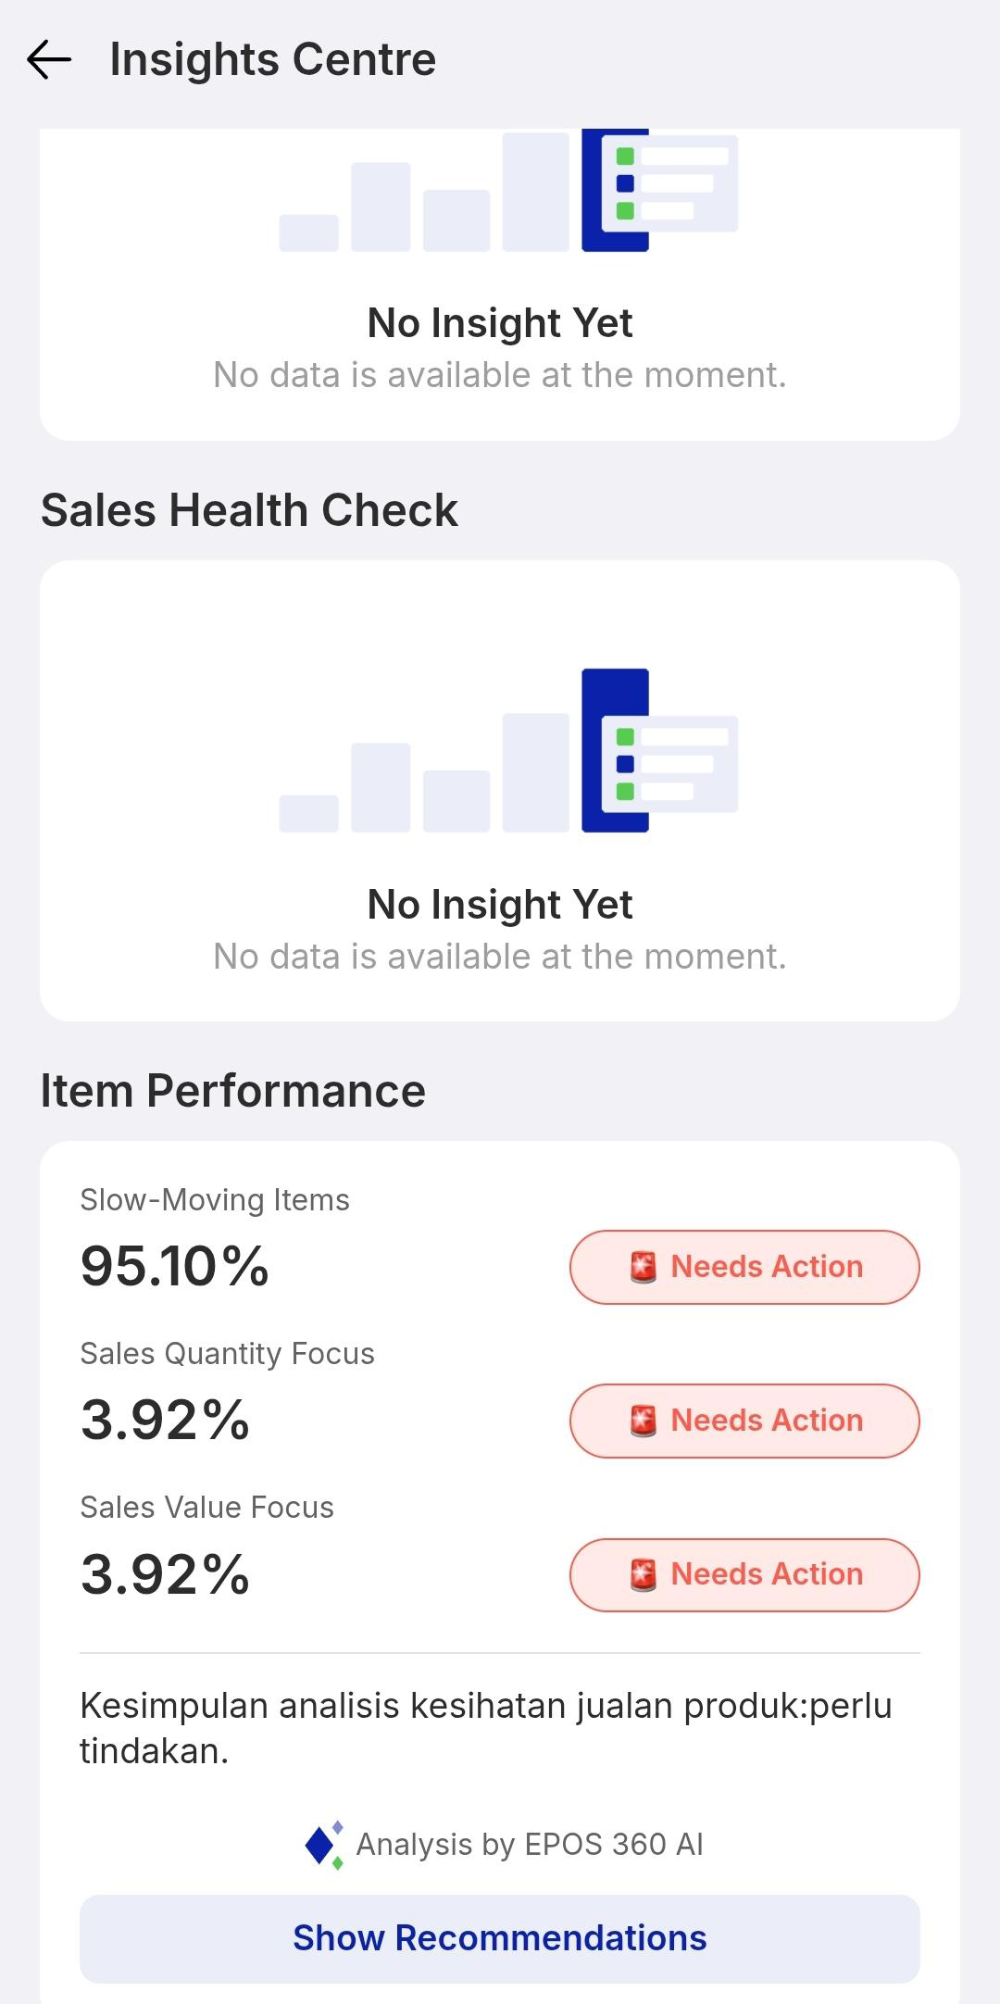
The first tab is a health monitor rather than a report. It shows how today is tracking against your daily sales target, flags slow-moving items that need a push, and lists upcoming holidays so you can order stock accordingly. Items marked Needs Action come with recommendations you can open.
Step 6: Check what promotions cost
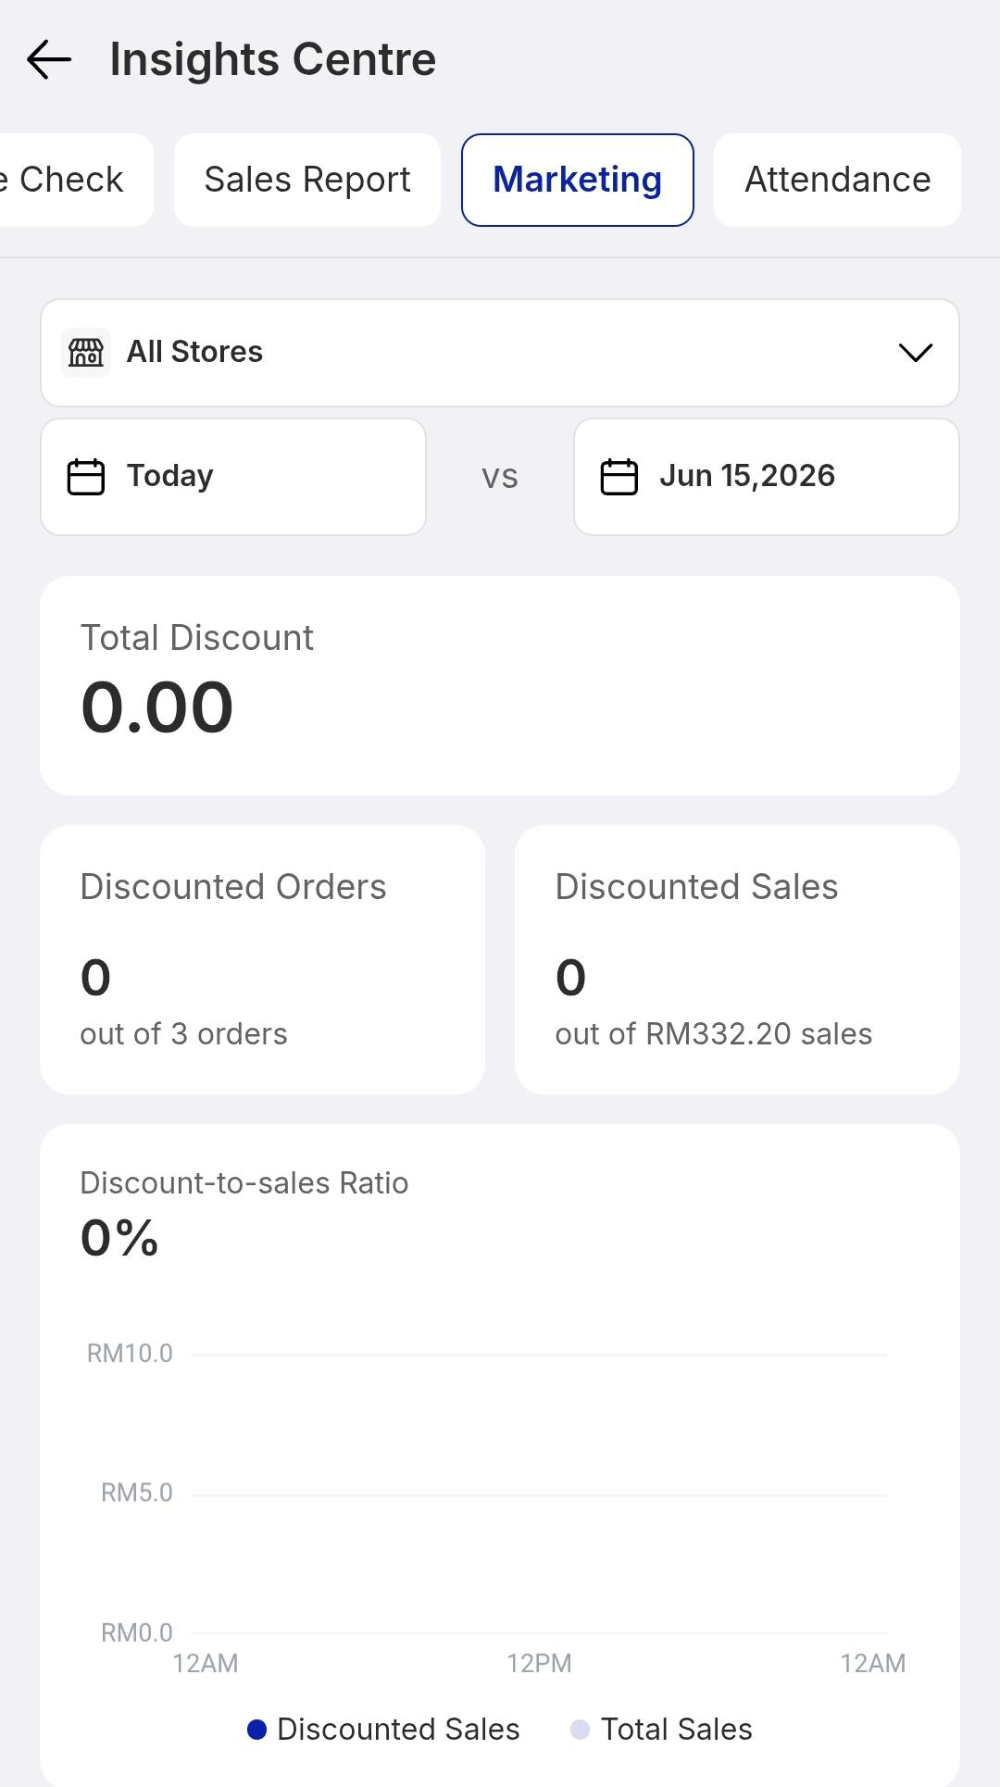
The Marketing tab keeps discounts honest: Total Discount given away, how many Discounted Orders out of all orders, the Discounted Sales they generated, and the discount-to-sales ratio. Read it before extending a campaign.
Step 7: Audit attendance and labour
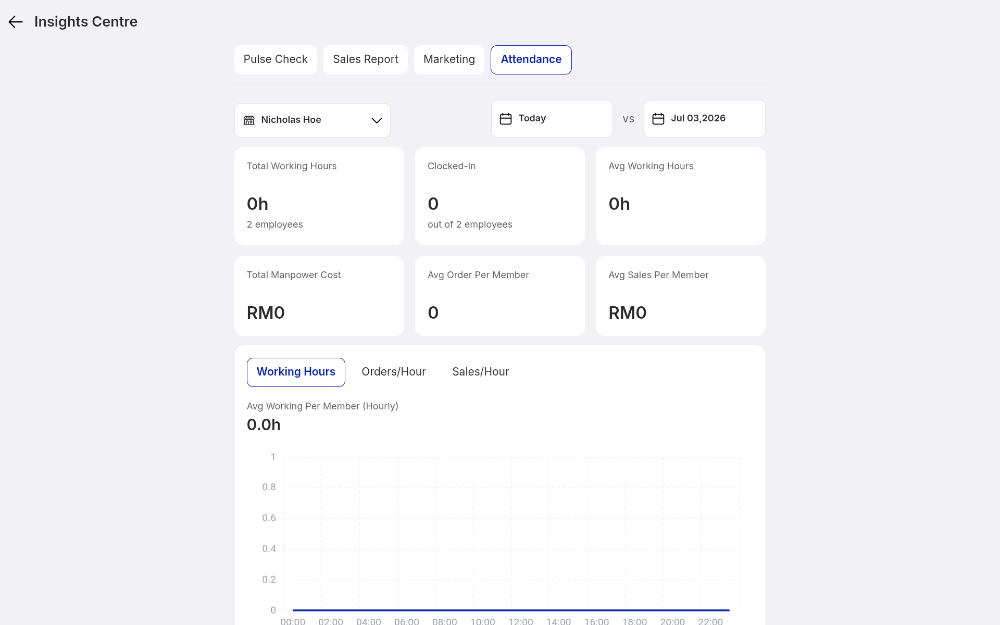
The last tab turns clock-ins into labour figures: Total Working Hours, who is clocked in right now, average hours, and Total Manpower Cost for payroll. Switch between Working Hours, Orders/Hour and Sales/Hour to see which operator is fastest on the register.
WATCH IT INSTEAD
Business overview features
IF IT LOOKS WRONG
There is no data in the selected window. Widen the date range, or check you have not filtered to a store with no sales.
That is the point of the ledger. Read the discounts, refunds and comps lines above Net Sales to see where it went.
Staff have not clocked in on their own logins. Employee accounts and check-in must be set up for these figures to fill.